Tourism Growth Is Uneven: Who Benefits Across Gunungkidul?
Tourism growth is usually reported in totals, but its benefits vary by location, business access, and local supply chains. Here is how Gunungkidul can measure who benefits, and where the evidence is still missing.
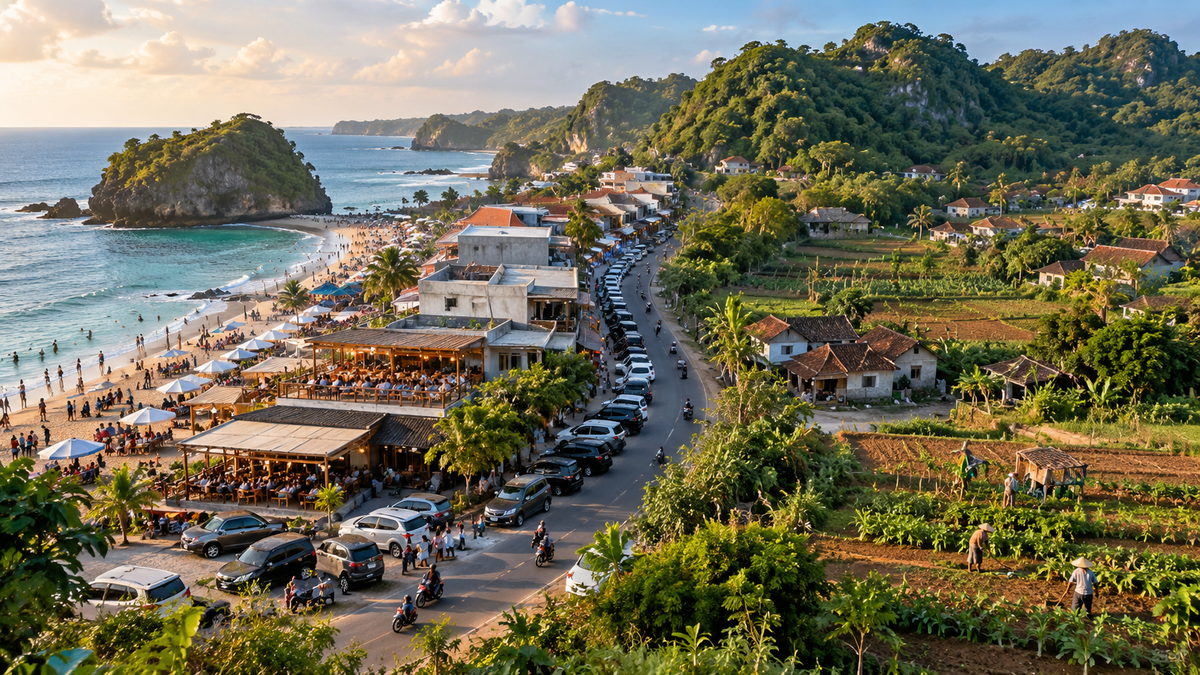
Tourism growth can be uneven across villages
A destination can attract more visitors while nearby villages see very different economic results. One community may host the main attractions, another may supply food or transport, and a third may experience traffic, land pressure, or higher service costs without receiving much visitor spending. Countywide figures can show that tourism is growing; they cannot, by themselves, show whether the gains are reaching a broad share of Gunungkidul’s residents.
That distinction matters because tourism is geographically concentrated by its nature. Beaches, caves, cultural sites, road access, accommodation, and visitor services are not evenly distributed. Nor are the capabilities needed to turn those assets into income. Businesses located near high-traffic routes may have better access to visitors, while producers in other areas may face higher transport costs, weaker promotion, or fewer links to formal buyers.
The relevant question is therefore which places and groups benefit, through what mechanism, and at whose expense.
What local evidence can and cannot tell us
The Central Statistics Agency (BPS) publishes district-level statistical collections such as Gunungkidul Regency in Figures 2025, covering a range of demographic, economic, infrastructure, and service indicators. The publication is useful for establishing the wider context, but a regency-wide total is not a distribution map of tourism income. Readers should not infer that every subdistrict or village experiences the same rate of growth from an aggregate number. BPS, Gunungkidul Regency in Figures 2025 (opens in a new tab).
A 2026 study of tourism potential and micro, small, and medium-sized enterprises (MSMEs) in Umbulrejo Tourism Village, Ponjong, offers a more localized lens. Using spatial analysis, the researchers found dispersed patterns for the types of tourism potential and MSMEs they mapped, while Blimbing hamlet contained the largest concentration of tourism objects. The study also argued that the area's diverse potential had not yet translated into a significant community contribution because management and use remained suboptimal. Its recommendations included better connections between attractions, infrastructure, local transport, and digital promotion. Pratama et al., Analisis Pola Persebaran Spasial Potensi Wisata dan UMKM di Desa Wisata Umbulrejo (2026) (opens in a new tab).
This is useful evidence for Umbulrejo, not proof of a district-wide pattern. It maps tourism potential and MSMEs, not a complete accounting of household income, wages, profit, land values, or the local share of visitor spending. A spatial map can show where assets are located; additional evidence is needed to show who owns them, who works in them, and where the revenue goes.
Four different maps are needed
To understand the geography of tourism benefits, local government and destination managers should map at least four distinct layers. Combining them into one score too early would conceal important differences.
1. Where visitors go
Start with visits by destination and period as well as the regency total. Where data collection permits, report visitor numbers by day, month, and season, with the counting method clearly stated. Ticket scans, visitor estimates, parking records, and survey counts are not automatically interchangeable. Their definitions need to be recorded before they are compared.
A map of visitor flows can reveal the places that attract demand and the roads or transport services connecting them. It should not be interpreted as a map of local prosperity: high visitation may coexist with low local retention if visitors buy few local goods or if businesses source most inputs elsewhere.
2. Where tourism income is retained
The second map should follow transactions. It should show the share of procurement that goes to suppliers in the same kalurahan, elsewhere in Gunungkidul, elsewhere in the Special Region of Yogyakarta, or outside the region. The same distinction applies to payroll and business ownership.
For example, a hotel may employ local residents but buy most food, furnishings, maintenance services, and booking services from suppliers outside the immediate area. Another business may have fewer employees but purchase produce, fish, craft products, and repair services nearby. Visitor totals cannot reveal the difference. Procurement records and anonymized supplier surveys can.
The goal is to identify practical barriers (reliability, volumes, food safety, packaging, delivery schedules, payment terms, and product consistency) and determine which can be addressed through supplier development, without requiring every business to purchase locally regardless of price or quality.
3. Who has access to opportunities
A third map should distinguish owners, paid workers, unpaid family contributors, informal vendors, contractors, and suppliers. Those roles represent different forms of participation and different levels of bargaining power. Ownership may generate profit and asset appreciation; employment generates wages; vending creates self-employment income; supplying a hotel may create repeat sales but also expose a small business to delayed payments or dependence on a single buyer.
Location alone does not tell us which group is better off. A business near a popular attraction may face high rent, intense competition, and seasonal income. A producer farther away may benefit from a stable supply contract. Both cases need to be measured rather than assumed.
4. Where costs and pressures occur
The fourth map should record public costs and environmental pressure: water supply, solid waste, wastewater, road maintenance, congestion, safety, land conversion, and access restrictions. Some communities may receive less direct visitor spending but still help carry the cost of maintaining roads, waste services, and water infrastructure used by visitors and businesses.
These costs should be measured separately from private revenue. Otherwise, a high-revenue destination may look more successful than it is once public services and environmental management are included.
Why a single “tourism benefit” ranking can mislead
A ranking of villages by visitor numbers or attraction counts is easy to communicate, but it can reward visibility rather than local welfare. It may also disadvantage places whose role is supplying food, labor, crafts, transport, or conservation services rather than hosting the main attraction.
A responsible dashboard should keep the indicators visible separately. At minimum, it could report visitor volumes, local procurement share, the number and type of jobs, wages and hours where lawfully collected, MSME participation, estimated local value added, seasonality, public-service costs, and environmental indicators. Each figure should include its period, geographic unit, source, and method.
The distributional question also requires disaggregation, with privacy protection. Data should distinguish residents from outside business owners where the distinction is lawfully and reliably measurable, but should not publish sensitive household or landowner information. Small-area results may need to be aggregated when publishing them could identify a household or expose commercially sensitive information.
What would make local benefit measurable?
Gunungkidul could begin with a modest annual local-benefit survey instead of waiting for a perfect data system. A sample of tourism businesses across different locations and sizes could report the share of spending that goes to local payroll, local suppliers, nonlocal suppliers, utilities, taxes or retribution, and environmental services. Worker and MSME surveys could then test whether the business-side estimates correspond to lived experience.
The survey should include destinations with different profiles: coastal attractions, caves, village-based tourism, and supporting commercial areas. Sampling only the busiest destinations would reproduce the same visibility bias the survey is intended to detect. Methods should be documented and repeated consistently so that year-to-year changes mean something.
The results should lead to action. If businesses cannot find reliable local suppliers, procurement matchmaking and product-standard support may be appropriate. If smaller villages lack transport links, planners can test whether better connections generate visits and spending rather than simply moving traffic through. If residents carry public-service costs without adequate funding, budget and contribution options should be evaluated openly.
A fairer question for tourism policy
The Umbulrejo study shows why a local spatial lens can help identify where tourism assets and small businesses are located. It does not establish which locations receive the largest net economic benefit across Gunungkidul. That requires linked data on visitors, ownership, jobs, procurement, household outcomes, public costs, and environmental pressure.
Until those measures exist, claims that tourism growth is automatically shared, or that benefits are concentrated everywhere in the same way, go beyond the evidence. A better approach is to publish what is known, identify what remains unmeasured, and build a repeatable system that can show which communities are gaining, which are being left out, and what policy could change the result.
Sources consulted
- BPS-Statistics Indonesia, Gunungkidul Regency. Gunungkidul Regency in Figures 2025. Published 28 February 2025. Accessed 26 October 2026. https://gunungkidulkab.bps.go.id/en/publication/2025/02/28/3aaca00e571452697d05b31b/gunungkidul-regency-in-figures-2025.html (opens in a new tab)
- Pratama, Z. A. W., Widiyatmoko, W., Wibowo, Y. A., & Susilawati, S. A. Analisis Pola Persebaran Spasial Potensi Wisata dan UMKM di Desa Wisata Umbulrejo, Kapanewon Ponjong, Kabupaten Gunungkidul [Spatial Distribution of Tourism Potential and MSMEs in Umbulrejo Tourism Village]. Jurnal Pendidikan IPS, Vol. 16, Issue 1 (2026). Accessed 26 October 2026. https://www.ejournal.tsb.ac.id/index.php/jpi/article/view/4082 (opens in a new tab)
- BPS-Statistics Indonesia, Gunungkidul Regency. Statistik Kesejahteraan Rakyat Kabupaten Gunungkidul 2025 [People’s Welfare Statistics of Gunungkidul Regency 2025]. Published 28 November 2025. Accessed 26 October 2026. https://gunungkidulkab.bps.go.id/id/publication/2025/11/28/42fef4bc3c747bb47a9ae28d/statistik-kesejahteraan-rakyat-kabupaten-gunungkidul-2025.html (opens in a new tab)
Keep reading
This article is part 4 of 9 in the series "Community and Livelihoods in Gunungkidul".
- Previous: From Entry-Level Work to Skilled Tourism Careers in Gunungkidul
- Start of the series: How Does Tourism Change Everyday Life in Coastal Communities?
Related articles: