Does Tourism Growth Raise the Cost of Living for Gunungkidul Residents?
Tourism may affect rents, everyday prices, transport costs, and access to public space, but general inflation figures cannot prove that tourism is responsible. Gunungkidul needs a local household cost basket and a credible comparison between tourism-intensive and less tourism-dependent areas.
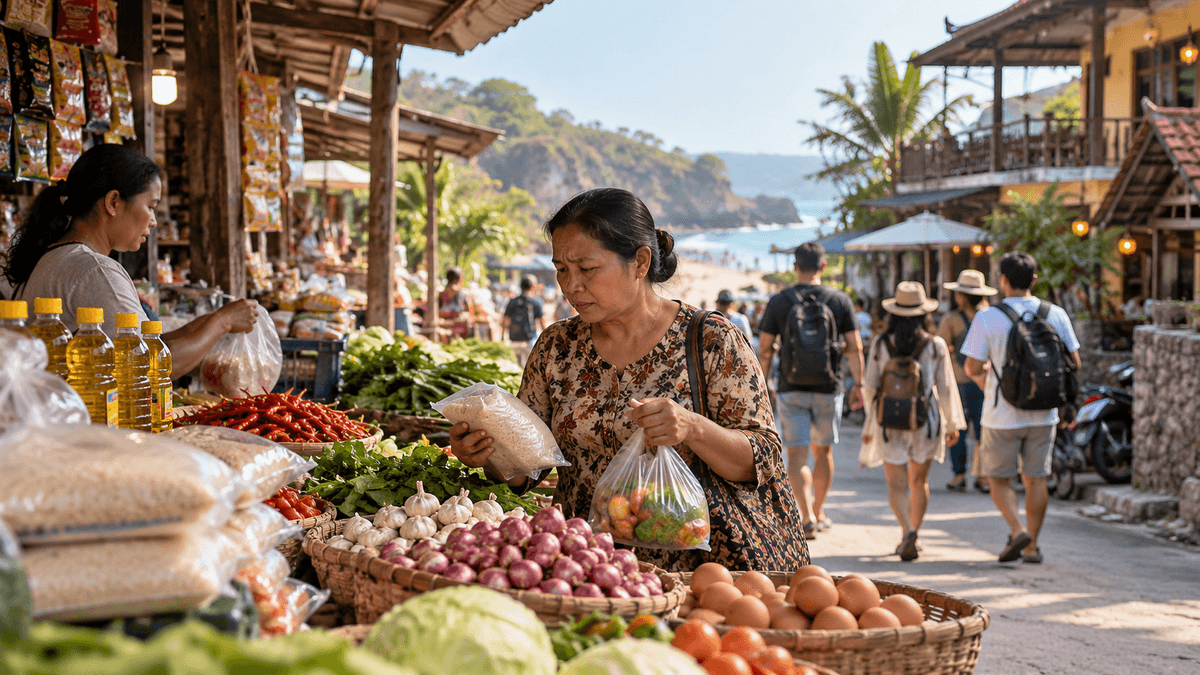
A busy destination can be more valuable and more expensive to live in
Tourism can bring spending into a local economy, create work, and support shops, transport providers, food businesses, and accommodation. It can also increase demand for certain goods, services, rental properties, transport, or commercially attractive locations. Whether this places a heavier burden on residents is an empirical question, not an automatic consequence of tourism growth.
For Gunungkidul, the central policy question is specific: are household living costs changing faster in tourism-intensive places than in comparable areas, and do resident incomes and access to essential services keep pace? Answering it requires more than citing an inflation rate or noting that land values have changed in a popular location.
The distinction matters because general inflation is driven by many forces. Food supply, energy costs, national monetary conditions, weather, transport prices, changes in household demand, and local distribution all affect what residents pay. Tourism may contribute to some local price pressures, but it should not be treated as the cause without evidence separating its effect from these other factors.
What the available price data shows
The most recent location-specific figure identified in this review is for September 2026. Radar Jogja reported on 1 October, quoting the head of BPS Gunungkidul, that year-on-year inflation reached 3.07%, monthly inflation was 0.24%, and year-to-date inflation was 1.72% (Fajar, 2026 (opens in a new tab)). This is a media report of official statistics, not a tourism-impact assessment. For August 2026, Media Indonesia reported year-on-year inflation of 2.87% and a CPI of 110.54, citing BPS DIY (Hardi, 2026 (opens in a new tab)). An earlier official local release from BPS Gunungkidul reported year-on-year inflation of 2.33% and a CPI of 110.26 for April 2026 (BPS Gunungkidul, released 4 May 2026 (opens in a new tab)). These figures refer to different reporting months and source routes; they are not conflicting rates for the same period. None isolates prices in tourism villages or establishes a tourism-related cause.
These figures show consumer-price movements at the geographic level covered by the index. They do not tell us whether a family living near a busy beach faces higher prices than a comparable family in a less tourism-intensive village. They also do not establish whether any observed difference is caused by tourism.
A consumer price index tracks the movement of a defined basket of goods and services using a weighted methodology. It is useful for macro-level price trends, but a regency-level CPI is not a village-by-village affordability index. It also measures price movements rather than the full burden of costs relative to household income.
The evidence therefore supports a careful conclusion: public indicators document changes in consumer prices, but the sources reviewed do not establish whether tourism-intensive neighborhoods have experienced a distinct tourism-related increase in the cost of living. The latest local-level figure used here is explicitly attributed to secondary reporting; direct BPS tables and any subsequent releases should be consulted when updating this article.
Four channels through which tourism could affect household costs
1. Housing and commercial rents
A location may become more attractive for accommodation, food service, retail, or other visitor-facing businesses. If demand for space changes, households renting homes or small shops may face different terms. Yet the direction and scale of that effect can vary widely: a tourism area may have rising rents, stable rents, or limited rental activity, depending on location, infrastructure, tenure, demand, and supply.
This article does not treat land price or displacement as its main topic. The narrower question is whether recurring housing and business occupancy costs place pressure on residents’ monthly budgets. Useful measures include rent paid by tenants, changes at renewal, deposits, utility charges, and rent as a share of disposable household income. Owner-occupied homes also have costs, but their imputed housing value should not be mixed casually with cash rent paid by tenant households.
2. Food and everyday retail
More customers can support local shops and food businesses. In some conditions, stronger demand may encourage higher prices; in other conditions, additional supply or competition may keep prices stable. A change in the price of a restaurant meal for tourists is not the same as a change in the cost of basic groceries for residents.
A local study should track a small, transparent basket of common items (such as rice, eggs, cooking oil, vegetables, drinking water, and household fuel) using consistent quantities and product grades. Record whether a shop is located in a tourism-intensive area, serves mainly residents or visitors, and changes prices during peak periods. Without that detail, a high menu price may be mistaken for a general rise in living costs.
3. Transport and access to essential services
Traffic, parking conditions, altered routes, and the distance between homes and essential services may change the time and cost of daily trips. These impacts can be uneven. A resident might face extra travel time during holiday periods but little change on ordinary weekdays. Another may benefit if a road improvement reduces travel time to work, school, health care, or markets.
Measure actual household travel costs, time, frequency, and destination as well as the volume of vehicles entering a tourist area. Where public transport options are limited, researchers should also distinguish direct fares from fuel costs, vehicle maintenance, and time lost to congestion.
4. Access to public space and basic facilities
Pressure on beaches, parking, water, sanitation, waste collection, and other shared services can affect residents even if a posted price does not change. These effects should not be converted into a monetary cost without a clear method. They can instead be tracked through access time, reliability, service complaints, household expenditure on substitutes, and residents’ reported experience.
The analysis should avoid automatically assigning every service problem to tourism. Local maintenance, investment levels, seasonal weather, population changes, and institutional responsibility may also explain gaps. The task is to test which pressures are more common or severe in areas exposed to higher visitor demand.
How to test whether tourism is a contributing factor
The most useful study would compare households and prices across locations with different levels of tourism exposure. A simple list of expensive and inexpensive villages would not be enough: tourism areas may also differ in road access, distance to markets, housing stock, income, and proximity to urban centers.
A practical study can proceed in five steps.
Step 1: Define tourism exposure before collecting prices
Classify areas using transparent measures such as visitor counts, tourism business density, accommodation capacity, or the share of local employment in visitor-facing activities. Do not label a location “tourism-intensive” solely because it is well known or has a popular beach. State the measurement period and the limits of the proxy.
Step 2: Choose comparison areas
Select less tourism-dependent communities that are reasonably comparable in access, settlement pattern, household structure, and distance to major markets. Explain differences that cannot be controlled. A comparison is useful only if it provides a credible benchmark for what may have happened without the same degree of tourism exposure.
Step 3: Build a transparent household cost basket
Collect prices at consistent intervals and record unit size, quality, vendor type, and location. Separately survey households about actual rent, monthly food spending, transport, utilities, education, health care, and other essential costs. Do not combine a retail price index with household spending totals as though they are the same indicator.
A useful dashboard could include:
| Measure | What it answers | Minimum quality control |
|---|---|---|
| Cost of a fixed essential-goods basket | How the price of common goods changes | Same item, quality, and unit across locations |
| Rent and utility burden | How housing costs affect tenants | Separate renters from owner-occupiers and commercial tenants |
| Essential transport cost and time | How access affects everyday mobility | Use repeated trips and note peak versus ordinary days |
| Household expenditure and income | Whether essential costs consume a larger budget share | Collect income ranges carefully and report missing data |
| Public-service access | Whether residents face additional time or out-of-pocket expenses | Record service interruptions and substitute costs |
Step 4: Observe changes over time
A single survey cannot distinguish a temporary holiday surge from a long-term change. Monthly price checks and household surveys repeated over at least a full seasonal cycle are a better starting point. Longer data series are preferable when researchers want to estimate the effect of a new road, destination, or tourism facility.
If suitable before-and-after data and a credible comparison area exist, a difference-in-differences design may help estimate whether costs changed more in exposed locations than in the comparison group. It requires important assumptions, especially comparable pre-existing trends. Without those conditions, results should be described as associations or descriptive differences rather than causal effects.
Step 5: Compare cost changes with household resources
A rising price does not affect every household equally. A small increase in food prices may matter more to a low-income household that spends a large share of its budget on necessities. A tenant may be more exposed to rent increases than a household that owns its home. A business owner may see both higher costs and higher revenue.
Researchers should therefore report both price changes and affordability indicators, including essential expenditure as a share of disposable income. A policy conclusion that ignores household income, tenure, and livelihood differences may misidentify who is under the greatest pressure.
What policymakers should do while the evidence is incomplete
The absence of a proven tourism effect is a reason to respond proportionately to residents’ concerns and to improve measurement.
First, BPS, local government, and village administrations can identify which price and household-budget data are already available and what must be collected locally. Second, tourism managers and local authorities can publish clear information about parking, fees, service arrangements, and temporary traffic management so that visitor activity does not create avoidable costs or confusion. Third, housing and local economic monitoring should distinguish household rents, commercial rents, land transactions, and business revenue rather than combine them into one vague indicator.
Where specific cost pressures are verified, responses should target the mechanism. Examples might include improving public transport, protecting access to essential services, expanding supply where appropriate, coordinating seasonal operations, or supporting households that face a documented affordability problem. Broad restrictions on tourism or unsupported claims about price gouging would not follow from general inflation figures alone.
The key evidence gap is a matched time series of housing rents, essential-goods prices, household transport costs, and disposable income for tourism-intensive and comparison areas. The sources reviewed did not provide such a dataset. BPS, village administrations, local market managers, and a structured household survey could help build one. Until those data exist, the article can identify mechanisms and a measurement design, but it cannot quantify tourism’s causal contribution to local living costs.
Conclusion: Measure affordability as well as prices
Tourism can alter local demand, but a causal claim about living costs requires evidence that separates tourism from wider inflation and other differences between places. BPS data provides a useful macroeconomic reference; it does not by itself reveal which households are under pressure or why.
For Gunungkidul, the defensible next step is a transparent local cost-of-living study that compares household budgets, essential prices, housing costs, transport, and access to services across tourism-intensive and less tourism-dependent areas. The aim is to discover whether there is a measurable difference, identify who experiences it, and select a policy response that matches the evidence.
Sources consulted
- Badan Pusat Statistik Kabupaten Gunungkidul. “Perkembangan Indeks Harga Konsumen Kabupaten Gunungkidul April 2026.” Released 4 May 2026. https://gunungkidulkab.bps.go.id/id/pressrelease/2026/05/04/1247/development-of-the-gunungkidul-regency-consumer-price-index-april-2026.html (opens in a new tab). Checked 26 October 2026.
- Badan Pusat Statistik Kabupaten Gunungkidul. “Perkembangan Indeks Harga Konsumen Kabupaten Gunungkidul Desember 2025.” Released 5 January 2026. https://gunungkidulkab.bps.go.id/id/pressrelease/2026/01/05/1243/perkembangan-indeks-harga-konsumen-kabupaten-gunungkidul-desember-2025.html (opens in a new tab). Checked 26 October 2026.
- Badan Pusat Statistik Provinsi D.I. Yogyakarta. Indeks Harga Konsumen Provinsi Daerah Istimewa Yogyakarta 2025 [Consumer Price Index of the Special Region of Yogyakarta Province 2025]. Released 10 April 2026; publication page checked 26 October 2026. https://yogyakarta.bps.go.id/id/publication/2026/04/10/db323a6e5fa2bf2123201f7a/the-consumer-price-index-of-daerah-istimewa-yogyakarta-province-2025.html (opens in a new tab). Consulted for the statistical series context; no specific item count is asserted in this article.
- Fajar, Dzika. “Inflasi Kabupaten Gunungkidul Capai 3,07 Persen, Beras dan Cabai Rawit Jadi Penyumbang Utama.” Radar Jogja, 1 October 2026. https://radarjogja.jawapos.com/amp/gunungkidul/2610010072/inflasi-kabupaten-gunungkidul-capai-307-persen-beras-dan-cabai-rawit-jadi-penyumbang-utama (opens in a new tab). Report quotes the head of BPS Gunungkidul on September 2026 inflation; treated as secondary reporting. Checked 26 October 2026.
- Hardi, Ardi Teristi. “BPS DIY Catat Inflasi 0,27 Persen pada Agustus 2026, Kelompok Perawatan Pribadi Melonjak.” Media Indonesia, 1 September 2026. https://mediaindonesia.com/nusantara/928498/bps-diy-catat-inflasi-027-persen-pada-agustus-2026-kelompok-perawatan-pribadi-melonjak (opens in a new tab). Used as secondary reporting of BPS’s August 2026 figures; checked 26 October 2026.
Keep reading
This article is part 2 of 9 in the series "Community and Livelihoods in Gunungkidul".
- Previous: How Does Tourism Change Everyday Life in Coastal Communities?
- Start of the series: How Does Tourism Change Everyday Life in Coastal Communities?
Related articles: