Gunungkidul’s Economy Is Growing. How Much Comes From Tourism?
Gunungkidul’s economy grew by 5.47% in 2025, but tourism is only one part of a diverse regional economy. Here is what the latest economic data can, and cannot, tell us about tourism’s contribution.
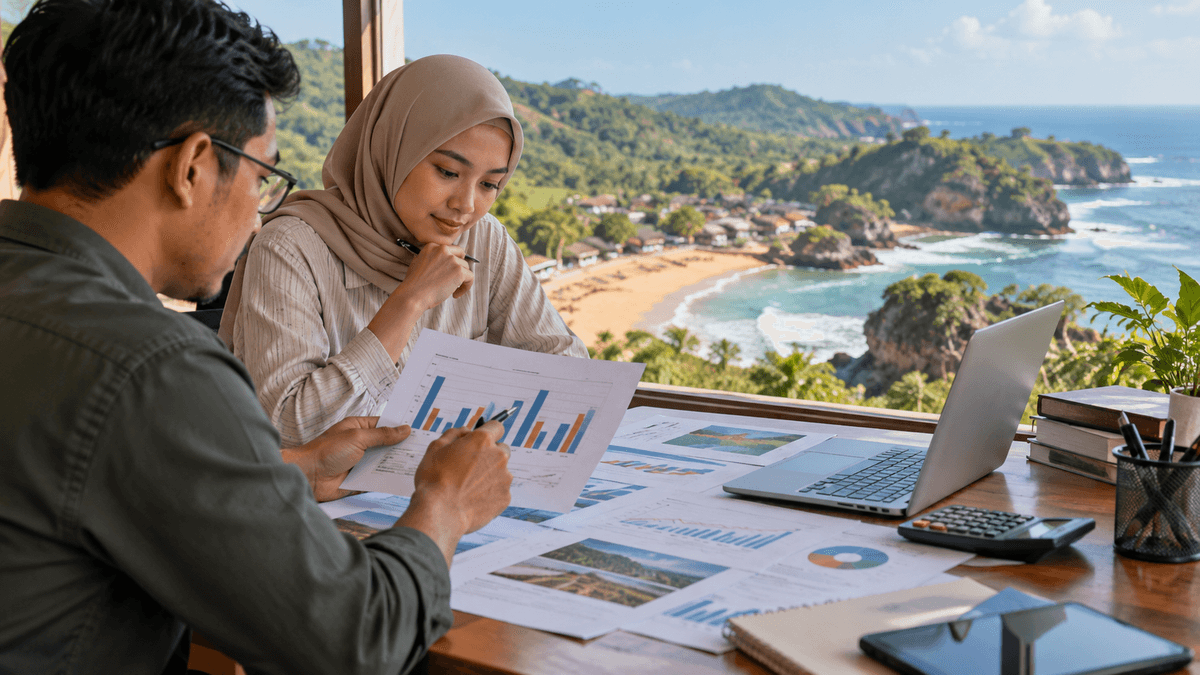
Gunungkidul’s growth story is bigger than tourism
Tourism has become a visible part of Gunungkidul’s development story. Visitors arrive for the regency’s beaches, caves, hills, and other attractions; businesses sell food, transport, accommodation, tickets, and souvenirs around those trips. Yet a busy destination is not the same thing as an economy transformed by tourism. To understand the scale of tourism’s role, we need to start with the wider economy, not with visitor numbers alone.
Statistics Indonesia (BPS) reported that Gunungkidul’s economy grew 5.47% in 2025, accelerating by 0.66 percentage points from 2024. The regency’s gross regional domestic product (GRDP) at current prices reached IDR 28.87 trillion, while GRDP at constant 2010 prices was IDR 17.41 trillion. These are different measures: current-price GRDP reflects the value of production at prices in the period, while constant-price GRDP is designed to track real output changes after adjusting for price changes. They should not be compared as if they were two estimates of the same thing.
The figures come from BPS-Statistics Indonesia, Gunungkidul’s release on the 2021-2025 GRDP by industry publication, issued on 6 April 2026. See the official BPS release (opens in a new tab) and the 2021-2025 GRDP publication (opens in a new tab).
The first lesson is straightforward: economic growth is real and measurable, but it does not tell us by itself which sectors caused the growth, how much of it came from visitors, or how evenly the gains were distributed.
Tourism operates inside a wider economic system
In 2025, agriculture, forestry, and fishing accounted for 25.32% of Gunungkidul’s GRDP at current prices, according to the same BPS release. Wholesale and retail trade, including motor-vehicle repair, accounted for 8.80%, while information and communication accounted for 8.63%. Those figures put tourism in context: the regency’s economy extends well beyond tourism, and its largest reported industry grouping remains agriculture, forestry, and fishing.
Tourism also cannot be isolated neatly by looking at only one line in the standard industry accounts. A visitor may pay for a room, a meal, fuel, a guide, a boat trip, or a souvenir. Those purchases are recorded across different industries. Meanwhile, accommodation businesses also serve non-tourism customers, restaurants sell to residents, and retailers serve both visitors and local households. The accommodation and food-service industry is therefore relevant to tourism, but it is not a complete measure of tourism’s total contribution.
A tourism-specific economic account can, in principle, connect visitor demand with the industries that supply it. Without a transparent tourism satellite account or a clearly documented local estimate, however, it would be misleading to assign the full value of a broad industry to tourism, or to claim that every rupiah spent by a visitor becomes local income.
Three measures answer three different questions
A useful discussion of tourism and local prosperity separates at least three indicators.
1. Economic output. GRDP measures the value added generated by resident production units within the region. It is useful for understanding the scale and direction of the economy, but it is not identical to household income, business profit, tax revenue, or the amount of cash circulating in a destination.
2. Visitor demand. Visitor counts, spending estimates, and length of stay describe tourism activity. They help explain the market that local firms may serve. But a count of arrivals does not show how much each visitor spends, which products they purchase, whether businesses are locally owned, or what costs the visit creates.
3. Distribution of benefits. Wages, business ownership, procurement from local suppliers, household income, and the quality of jobs help establish who gains from tourism. These indicators are closer to the practical question residents ask: does tourism create reliable opportunities for people who live here?
No one indicator can substitute for the others. Higher output may coexist with uneven income distribution. More visitors may benefit some businesses more than others. Higher spending per visit may reflect prices, visitor mix, or survey design rather than a universal improvement in local welfare.
What the current data supports and what it leaves open
The BPS figures support the conclusion that Gunungkidul’s real economy expanded in 2025 and that agriculture, trade, and information and communication remain significant parts of its production structure. Tourism plausibly connects with several of these activities, especially retail, food services, transport, and accommodation. That connection is an economic mechanism, not a quantified estimate of tourism’s share of growth.
The data does not establish that tourism alone drove the 5.47% growth rate. Nor does it demonstrate that the gains reached all villages, workers, or household-income groups. Those claims require sector-level change over time, evidence on visitor demand, and information about employment, wages, ownership, supplier purchases, and household outcomes.
For a stronger local assessment, policymakers and researchers should publish a repeatable tourism dashboard with consistent definitions: visitor counts by destination and period; the method used to estimate spending; accommodation occupancy and length of stay; tourism-related employment and wages; the share of procurement sourced from Gunungkidul businesses; public revenue and service costs; and relevant environmental indicators. The dashboard should show its methodology and revisions so that figures can be compared from year to year.
How tourism matters to the local economy
Tourism can expand markets for small businesses, create jobs, and increase demand for local products. It can also concentrate activity in certain places or seasons, raise pressure on infrastructure, and leave some suppliers with little negotiating power. Which pattern dominates depends on how businesses buy, hire, invest, and manage visitor impacts, as well as on the number of arrivals.
The practical standard for success should therefore combine economic growth with evidence about local retention and distribution. Does the sector purchase more from local farms, fisheries, and small manufacturers? Are jobs stable enough to support households beyond peak periods? Can public revenue cover the infrastructure and management costs associated with visitors? Do communities retain meaningful access to the resources on which their livelihoods depend?
Gunungkidul’s 2025 growth figure is an important starting point. The next step is to follow the money from visitor demand to output, wages, business income, public services, and the communities that bear the costs and receive the benefits.
Sources consulted
- BPS-Statistics Indonesia, Gunungkidul. “Telah Rilis Publikasi PDRB Kabupaten Gunungkidul menurut Lapangan Usaha 2021-2025” [Release of the 2021-2025 GRDP by Industry publication]. Published 6 April 2026. https://gunungkidulkab.bps.go.id/id/news/2026/04/06/216/telah-rilis-publikasi-pdrb-kabupaten-gunungkidul-menurut-lapangan-usaha-2021-2025.html (opens in a new tab). Accessed 25 October 2026.
- BPS-Statistics Indonesia, Gunungkidul. Gross Regional Domestic Product of Gunungkidul Regency by Industry 2021-2025. Published 6 April 2026. https://gunungkidulkab.bps.go.id/en/publication/2026/04/06/247869156d79f3ba4b3b0c3d/gross-regional-domestic-product-of-gunungkidul-regency-by-industry-2021-2025.html (opens in a new tab). Accessed 25 October 2026.
- Bappeda Kabupaten Gunungkidul. RPJMD Kabupaten Gunungkidul Tahun 2025-2029 [Gunungkidul Regency Medium-Term Development Plan 2025-2029]. Published 2025. https://bappeda.gunungkidulkab.go.id/wp-content/uploads/2025/09/RPJMD-2025-2029-KABUPATEN-GUNUNGKIDUL.pdf (opens in a new tab). Accessed 25 October 2026.
Keep reading
This article is part 1 of 12 in the series "Gunungkidul's Tourism Economy, Explained".
Related articles: